The "all-in-one" NOAA CoastWatch / OceanWatch Data Portal for viewing products and accessing data files has been updated with new features and more data: Visualize, layer, geographically and temporally subset data products and download files for your selections
Overview
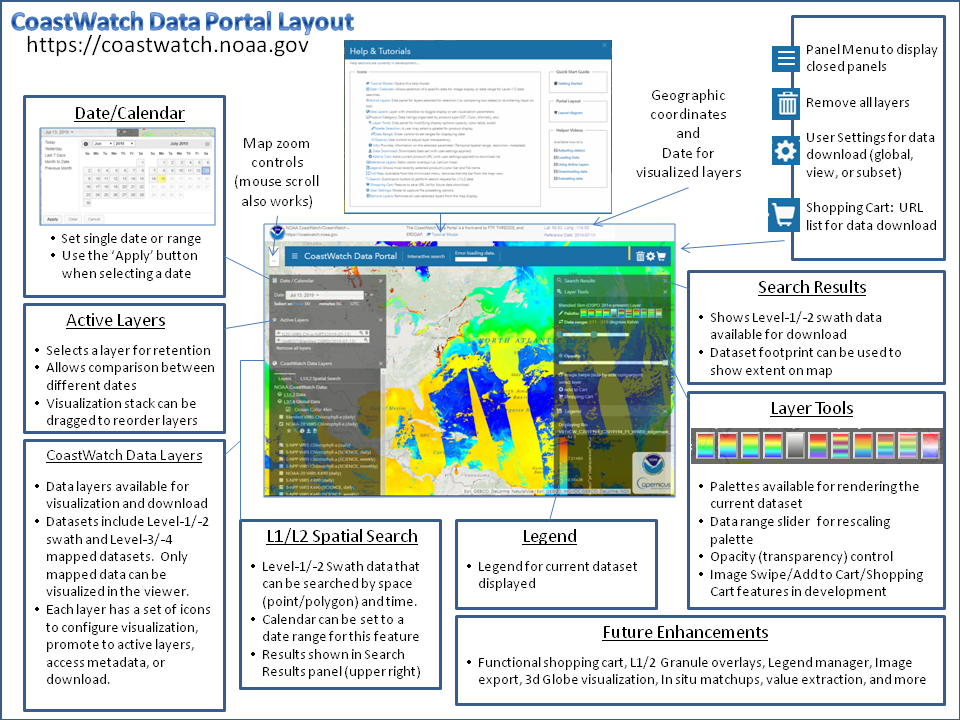
The data portal provides visualization of CoastWatch oceanographic satellite data. Layers (from different dates) can be viewed simultaneously and the associated data file (NetCDF) downloaded for local analysis. The portal has a number of useful features. These notes are to help acquaint new users with some of the top level features so their initial experiences are successful.
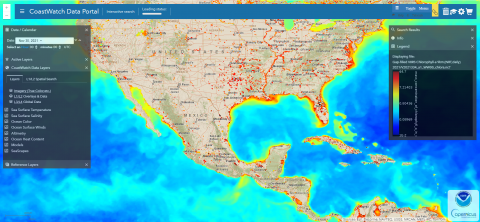
Upon opening, the portal will display a map background overlaid with S-NPP True Color and the global gap-filled VIIRS DINEOF 9km Chlorophyll-a product. These layers and more can be toggled on/off under the "CoastWatch Data Layers" panel. There is an exception to the default layers. During the Atlantic Ocean hurricane season, the portal may be in 'Storm Watcher' mode where the current hurricane forecast track and cone-of-uncertainty will be displayed on the most recent GOES-16 GeoColor imagery (updated in 10 minute increments).
The date for the display can be set under the "Date/Calendar Panel" (after choosing your dates, remember to click "Apply" to set the request).
Gridded or mapped data can be downloaded as a full extent or subset dataset in NetCDF. Level-1/-2 data are only available as a full extent dataset.
Help and tutorials are provided to illustrate the functionality of the portal.
- Quick Start
- Tutorial Videos
- Locate Level-1 or Level-2 unmapped data (spatial search)
- Adding your own or external data (drag and drop)
Quick Start
Help and tutorials are provided to illustrate the functionality of the portal. Development and improvements are underway, but please provide feedback to coastwatch.info@noaa.gov . At a minimum, the following options can be used to get started exploring data within the portal:
- Tutorial Modal: Opens the Help and Tutorial modal
- Date / Calendar: Allows selection of a specific date for image display or date range for Level-1/2 data searches.
- Data Layers: Layer with checkbox to toggle display or set visualization parameters
Tutorial Videos
Several tutorial videos have been created to show how to perform specific tasks.
- How To Use [ video pdf captions ]
- Loading Imagery [ video pdf captions ]
Searching for Level-2 Data [ video pdf captions ]
Spatial Search
Not all data are viewable in the portal. In fact, most satellite products come to us in what we call Level-1 and Level-2 data where 'pixels' are in the geometry of the sensor. The field of view or how much of the earth's surface fits within the scan pattern for the sensor means pixels may be of different sizes. These data can be discovered within the portal and are often accompanied by a preview image. Data are searched spatially. You drop a point or draw a polygon, set the date, and then search for data which intersects your feature. Results are returned as a list of thumbnails with links to larger preview images or data (NetCDF). The data links can also be added to a shopping cart to download later. A walk-through example of this type of search is on our forum.
Drag-and-Drop
Figure 1: Drag and drop a URL from an ArcGIS Service
You can add your own data to the portal map viewer display. Data must either be accessible to the web through an ArcGIS Service (MapServer, FeatureServer, or ImageServer) or a CSV (comma separated value) file on your local system or a webserver (Uniform Resource Locator - URL). Adding data is done using the drag-and-drop feature of HTML5 (Figure 1).
User data can be added provided the data are point data stored in a CSV text file. These can easily be generated using spreadsheet software. Make sure data coordinates are in Geographic/WGS84 and have one record per row. At a minimum, coordinate values must be present and the pairs labeled as latitude/longitude, lat/lon, x/y, Latitude/Longitude, or mean_lat/mean_lon. A 'date' column in the format of YearMonthDay ('YYYYMMDD') will be read by the portal and change the 'reference date' to the date-value in the first row of the user data. Future functionality will allow the portal to step through points and loading the corresponding satellite data by date. An example dataset is in Table 1:
| year | month | day | latitude | longitude | station | depth | CHL |
|---|---|---|---|---|---|---|---|
| 2014 | 11 | 11 | 32.5418 | -79.479 | 1 | 1 | 0.78041 |
| 2014 | 11 | 11 | 32.5418 | -79.479 | 1 | 1 | 0.76355 |
| 2014 | 11 | 12 | 32.0884 | -78.3956 | 2 | 1 | 0.17917 |
| 2014 | 11 | 12 | 31.8835 | -78.1404 | 3 | 1 | 0.20884 |
| 2014 | 11 | 12 | 31.8835 | -78.1404 | 3 | 98 | 0.21491 |
When these data are exported as CSV, a text file is generated where a comma separates each field. To add the data to the map display, simply drag the file (click-hold) and release on the map. Data are managed in the 'User Data' panel. This panel also allows the user to place point markers with or without track line connectors. URLs can also be included and other field data will appear as a pop-up when a point is clicked (Figure 2).
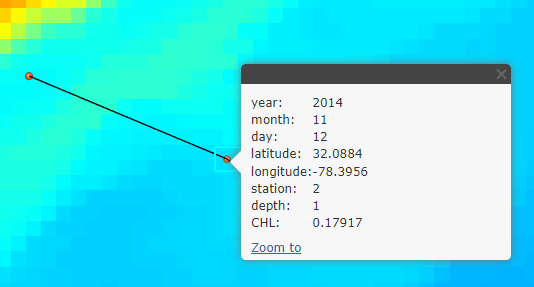
Figure 2: Field data assigned to each point (record)
Open the ArcGIS Service to the "ArcGIS REST Services Directory" for the desired endpoint. If you are not aware of ArcGIS REST Services, just do an Internet search for "ArcGIS REST Services Directory NOAA". This will show NOAA implementations of the services. URLs can be drag-and-dropped directly from the Services web page (Figure 1).
Data loaded from your own computer remains within the browser on your computer. In other words, NOAA CoastWatch does not have access to the data and the application does not share the data with other services. Only user-supplied CSV data can be removed from the map using the 'Clear My Data' button in the 'User Data' panel. ArcGIS REST data remains for the duration of the session.
This feature may not be compatible with all browsers.
Glossary
Tutorial Modal: Opens the help modal
- Date / Calendar: Allows selection of a specific date for image display or date range for Level-1/2 data searches.
- Active Layers: Side panel for layers selected for retention (i.e. comparing two dates) or re-ordering (layer on top)
- Data Layers: Layer with checkbox to toggle display or set visualization parameters
- Product Category: Data listings organized by product type (SST, Color, Altimetry, etc)
- Active Layers: Add layer to Active Layer list -- allows visualization of data from multiple dates
- Layer Tools: Side panel for modifying display options (opacity, color table, scale)
- Opacity: User control to adjust layer transparency.
- Data Range: Slider control to set ranges for displaying data
- Palette Selection: A user may select a palette for product display
- Info: Provides information and metadata on the selected dataset
- Monitor: Pop-up chart of data quality and statistics from OceanWatch Monitor
- Data Download: Downloads data set (with user-settings applied)
- Add to Cart: Adds current product URL (with user settings applied) to download list
- Reference Layers: Static vector overlays (i.e. Lat/Lon lines)
- Legend: Shows most recently selected product's color bar and file name
- Full Map: Available from the minimized menu, removes the title bar from the map view.
- Search: Submission button to perform search request for L1/L2 data
- Shopping Cart: Feature to save URL list for future data download.
- User Settings: Modal to capture file subsetting options
- Remove Layers: Removes all user-selected layers from the map display.