Search Panel
CoastWatch Product Search Tool
Please visit our Product Glossary to view the terms used by this search tool. Data, algorithms, and images presented on STAR websites are intended for experimental use only and are not supported on an operational basis (Disclaimer details).
| Product | Begins | Ends | Summary | Product Family | Product Measurement | Processing Algorithms | Processing Level | Spatial Coverage | Spatial Resolution | Product Latency | Platforms | Instruments |
|---|---|---|---|---|---|---|---|---|---|---|---|---|
| ACSPO Global 0.02º Gridded Super-collated SST and Thermal Fronts from Low-Earth-Orbiting Platforms (L3S-LEO) |
2000 | Present | NOAA Advanced Clear-Sky Processor for Ocean (ACSPO) L3S-LEO SST is a family of multisensor gridded ("L3") 0.02º resolution super-collated ("S") products. The L3S-LEO family is organized into three lines: PM, AM and Daily. The AM and PM lines correspond to 9:30am/pm and 1:30am/pm equator crossing times, respectively. The Daily line combines PM and AM (day and night) SSTs into a single daily L3S SST that is normalized to 1:30am viewing conditions. |
Sea Surface Temperature | Sea Surface Temperature - Polar-orbiting | ACSPO | Level 3 | Global | 2km+ | 0 Hours <= 24 Hours (NRT) | Aqua , MetOp , NOAA , SNPP , Terra | AVHRR , MODIS , VIIRS |
ACSPO Global SST from ABI
|
2017 | Present | The ABI SST data are produced from GOES-East (at present GOES-19, before 2025/04/06 GOES-16) and GOES-West (at present GOES-18, before 2023/01/10 GOES-17) satellite using the NOAA Advanced Clear-Sky Processor for Ocean (ACSPO) v.3.0 and v290 enterprise system. Currently, near-real time (NRT) data are produced at STAR, with a ~2-6 hour latency. A Reanalysis (RAN) dataset for GOES-16 is also available. The data are available in NetCDF4 format, compliant with the GHRSST Data Specifications v2 (GDS2). Currently, the data are archived on PO.DAAC and available at this Coast Watch page as a 2week rotated buffer. |
Sea Surface Temperature | Sea Surface Temperature - Geostationary | ACSPO | Level 2 , Level 3 | Western Hemisphere | 2km+ | 0 Hours <= 24 Hours (NRT) | GOES-East , GOES-West | ABI |
| ACSPO Global SST from AHI |
2019 | Present | The AHI SST data are produced from Himawari-9 (Himawari-8 before 2022-Dec-13) geostationary satellite using the NOAA Advanced Clear-Sky Processor for Ocean (ACSPO) v2.90 enterprise system,(ACSPO v2.70 was used for Himawari-8). Currently, only near-real time (NRT) data are produced at STAR, with a 2-6 hour latency (typically closer to 2 hours). The data are available in NetCDF4 format, compliant with the GHRSST Data Specifications v2 (GDS2). The data for Himawari-8 was archived with PO.DAAC with start date 2019-Oct-16 and end date 2022-Dec-13. The full mission of the Himawari-9 has been archiving in PO.DAAC. The data for Himawari-9 is also available at this Coast Watch page as a 2week rotated buffer. The reanalysis of the full mission of the Himawari-8 is available at this Coast Watch page. There is a plan to reprocess the AHI data, for the full Himawari-9 missions. |
Sea Surface Temperature | Sea Surface Temperature - Geostationary | ACSPO | Level 2 , Level 3 | East Asia & Western Pacific | 2km+ | 0 Hours <= 24 Hours (NRT) | Himawari | AHI |
ACSPO Global SST from AVHRR FRAC
|
2006 | Present | The AVHRR FRAC SST data are produced from AVHRR/3s onboard Metop-A, -B and -C satellites using the NOAA Advanced Clear-Sky Processor for Ocean (ACSPO) v2.80 enterprise system, described in (Ignatov et al., 2016). Currently, near-real time (NRT) L2P and 0.02° L3U (gridded uncollated) data for Metop-A, -B and -C is produced at STAR (with ~2 to 6hrs latency). The data are being archived at PO.DAAC, and also available at this CoastWatch page as a 2 weeks rotated buffer. Metop-A mission officially ended at 2021-11-15 and the production of the ACSPO SST for the Metop-A ended at 2021-11-14 due to data degradation on 2021-11-15. |
Sea Surface Temperature | Sea Surface Temperature - Polar-orbiting | ACSPO | Level 2 , Level 3 | Global | 100m < 2km , 2km+ | 0 Hours <= 24 Hours (NRT) | MetOp | AVHRR |
| ACSPO Global SST from AVHRR GAC |
1981 | Present | AVHRR GAC Reanalysis 2 (RAN2) dataset is an improved and extended version of AVHRR GAC RAN1 (Ignatov et al., 2016). RAN2 is produced from 5 AVHRR/2s (onboard N07/09/11/12/14) and 5 AVHRR/3s (N15/16/17/18/19) using the NOAA Advanced Clear-Sky Processor for Ocean (ACSPO) enterprise system v2.81. At the time of release, it covers from 1 Sep 1981 to 31 Dec 2021 and will be periodically extended as new L1b data from N15/18/19 arrive. Out of ten satellites, seven (N07/09/11/14/16/18/19) were initially launched into afternoon orbits (1:30pm/am), two (N12/15) into early-morning orbits (7:30pm/am), and one (N17) into mid-morning orbit (10am/pm). All NOAA orbits are not controlled and evolve in time. The RAN2 dataset is documented in (Petrenko et al. 2020 and 2021; Pryamitsyn et al. 2020) |
Sea Surface Temperature | Sea Surface Temperature - Polar-orbiting | ACSPO | Level 2 , Level 3 | Global | 2km+ | 0 Hours <= 24 Hours (NRT) | NOAA | AVHRR |
| ACSPO Global SST from MODIS |
2000 | Present | The ACSPO MODIS SST data are produced from Terra and Aqua satellites using the NOAA Advanced Clear-Sky Processor for Ocean (ACSPO) enterprise system (Ignatov et al., 2016). Complete archive of ACSPO MODIS SST data is available for both the Terra (24 Feb 2000 - present) and Aqua (4 July 2002 - present) missions in 0.02° L3C (level 3 collated) format. New data is added in delayed mode (DM) with a 2-month latency. The last orbital maintenance maneuvers for Aqua and Terra were performed on 27 Feb 2020 (Terra) and 18 Mar 2021 (Aqua) and their orbit has been drifting ever since. We do not recommend usage of ACSPO MODIS SST dated a year or later after each satellites' last orbital maintenance maneuver. For more recent SST data from low earth orbit satellites, we recommend the ACSPO VIIRS and AVHRR FRAC datasets. |
Sea Surface Temperature | Sea Surface Temperature - Polar-orbiting | ACSPO | Level 3 | Global | 2km+ | 24+ hours (Delayed) | Aqua , Terra | MODIS |
| ACSPO Global SST from VIIRS |
2012 | Present | These VIIRS SST data are produced using the NOAA Advanced Clear-Sky Processor for Ocean (ACSPO) SST system, from the afternoon NPP, N20 and N21 satellites, in two formats: L2P and L3U (uncollated). The data are reported in 10 min granule files in NetCDF4 format, compliant with the GHRSST Data Specifications v2 (GDS2). For each satellite, there are 144 granules per 24 hr interval, with a total data volume of ~7.1 GB/day for L2P, and ~0.4 GB/day for L3U. |
Sea Surface Temperature | Sea Surface Temperature - Polar-orbiting | ACSPO | Level 2 , Level 3 | Global | 100m < 2km , 2km+ | 0 Hours <= 24 Hours (NRT) , 24+ hours (Delayed) | NOAA , SNPP | VIIRS |
Along-track significant wave height, wind speed and sea level anomaly from multiple altimeters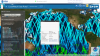
|
2016 | Present | The NOAA Laboratory for Satellite Altimetry's (LSA) sea surface height team produces 0.25-degree longitude/latitude Level-3 significant wave height, wind speed, and sea level anomaly (SLA) daily datasets by applying optimal interpolation to along-track satellite observations over the global ocean from a constellation of radar altimeter missions. Theses grids are produced with near-real time (3-5 hour latency) data. |
Sea Surface Height , Sea Surface Winds | Along-track Significant Wave Height , Sea Surface Height Anomalies , Sea Surface Wind Speed | RADS | Level 2 | Global | 2km+ | 0 Hours <= 24 Hours (NRT) | CryoSat-2 , JASON-2 , JASON-3 , SARAL , Sentinel-3 , Sentinel-6 | AltiKa , Poseidon-3 , Poseidon-3B , SIRAL , SRAL |
| AMSR2 - Sea Ice Concentration |
N/A | Present | NOAA CoastWatch / OceanWatch / PolarWatch Sea Ice Concentration, Level 3, daily and daily 4-day rolling merge, polar stereographic mapped composites - AMSR-2 |
Polar Sea Ice | Sea Ice Concentration | N/A (Unspecified) | Level 3 | Polar (Artic/Antarctic) | 2km+ | 0 Hours <= 24 Hours (NRT) | GCOM-W | AMSR2 |
Experimental Eddy Products![Example of MESI product [zoomed from global] centered on the Atlantic Ocean.](sites/default/files/styles/thumbnail/public/2026-03/MESI_v1_multi_global_daily_s20260221_e20260221932d.png?itok=7HSANHuO)
|
2020 | Present | The sea surface height team in NOAA’s Laboratory for Satellite Altimetry produces two experimental mesoscale eddy products:
|
Ocean Currents , Sea Surface Height , Sea Surface Salinity , Sea Surface Temperature | Geostrophic Currents | N/A (Unspecified) | Level 3 , Level 4 | Global | 2km+ | 24+ hours (Delayed) | CryoSat-2 , GOES-East , GOES-West , Himawari , JASON-3 , Meteosat , MetOp , NOAA , SARAL , Sentinel-3 , SMAP , SNPP | ABI , AHI , AVHRR , SMAP , SRAL , VIIRS |
| Global Water Classification from VIIRS |
2012 | Present | The global water classification products are produced by the NOAA Ocean Color Science Team from the VIIRS-SNPP Level 2 Ocean Color data. Water classification data is 9km resolution, with daily, 8-day and monthly products generated. |
Ocean Color | Water Classification | MSL12 | Level 3 | Global | 2km+ | 24+ hours (Delayed) | NOAA , SNPP | VIIRS |
MSI Sentinel-2 Imagery
|
N/A | Present | MSI Sentinel-2 high spatial resolution imagery and data from Copernicus are served from CoastWatch for coastal US regions in near real time as the data become available. JPEG and TIF images as well as zipped Level 1C data are available. |
True Color Imagery | True Color Imagery (RGB) | N/A (Unspecified) | Level 1 | Selective Acquisitions | 0 m <= 100 m | 0 Hours <= 24 Hours (NRT) | Sentinel-2 | MSI |
| NOAA CoastWatch co-gridded VIIRS SST from ACSPO |
N/A | Present | NOAA CoastWatch co-gridded VIIRS SST products are Level 3 daily composites in compatible format and projection with other CoastWatch Level 3 sector and global products (such as CoastWatch sector VIIRS ocean color). Twenty four CoastWatch sector files mapped to equatorial projection that cover the globe (see Description tab for sector definitions) two polar stereographic sectors in 750 m nominal, native resolution and a global, 4 km resolution, single file mapped product is also available. These CoastWatch Level 3 products are generated from ACSPO L2P SST as input. |
Sea Surface Temperature | Sea Surface Temperature - Polar-orbiting | ACSPO | Level 3 | Global , CoastWatch Global Sectors | 100m < 2km , 2km+ | 0 Hours <= 24 Hours (NRT) | MetOp , NOAA , SNPP | AVHRR , VIIRS |
| NOAA Geo-Polar Blended Global Sea Surface Temperature Analysis (Level 4) |
2022 | Present | The NOAA geo-polar blended SST is a daily 0.05° (~5km) global high resolution satellite-based sea surface temperature (SST) Level-4 analyses generated on an operational basis. This analysis combines SST data from US, Japanese and European geostationary infrared imagers, and low-earth orbiting infrared (U.S. and European) SST data, into a single high-resolution 5-km product. The three flavors of blended SST products are night only; day/night, and diurnal warming. |
Sea Surface Temperature | Sea Surface Temperature - Geostationary , Sea Surface Temperature - Polar-orbiting | N/A (Unspecified) | Level 4 | Global | 2km+ | 0 Hours <= 24 Hours (NRT) | GOES-East , GOES-West , Himawari , Meteosat , MetOp , SNPP | ABI , AHI , AVHRR , SEVIRI , VIIRS |
| NOAA MSL12 multi-sensor DINEOF global 2 km gap-filled products: Chlorophyll-a, diffuse attenuation coefficient Kd(490), and suspended particulate matter (SPM) |
2018 | Present | The NOAA Multi-Sensor Level-1 to Level-2 (MSL12) Ocean Color, science quality, multi-sensor 2 km global gap-filled analysis includes chlorophyll-a, Kd(490), and SPM products. These global gap-free data are generated using the data interpolating empirical orthogonal function (DINEOF) method (Liu and Wang, 2023). This product currently uses data from 3 instruments: the Visible Infrared Imaging Radiometer Suite (VIIRS) sensor aboard the Suomi National Polar-orbiting Partnership (SNPP) satellite, VIIRS on the NOAA-20 satellite, plus the Ocean and Land Colour Instrument (OLCI) on the Sentinel 3A satellite from the Copernicus program of the European Union. |
Ocean Color | Chlorophyll-a Concentration , Diffuse Attenuation Coefficients , Suspended Particulate Matter | MSL12 | Level 4 | Global | 100m < 2km | 24+ hours (Delayed) | NOAA , Sentinel-3 , SNPP | OLCI , VIIRS |
| NOAA MSL12 multi-sensor DINEOF global 9km gap-filled products: Chlorophyll-a, diffuse attenuation coefficient Kd(490), and suspended particulate matter (SPM) |
2018 | Present | The NOAA Multi-Sensor Level-1 to Level-2 (MSL12) Ocean Color, science quality, multi-sensor global gap-filled analysis includes chlorophyll-a, Kd(490), and SPM products. These global gap-free data are generated using the data interpolating empirical orthogonal function (DINEOF) method (Liu and Wang, 2022). The data that go into this product currently come from 3 instruments: the Visible Infrared Imaging Radiometer Suite (VIIRS) sensor aboard the Suomi National Polar-orbiting Partnership (SNPP) satellite, VIIRS on the NOAA-20 satellite, plus the Ocean and Land Colour Instrument (OLCI) on the Sentinel 3A satellite from the Copernicus program of the European Union. |
Ocean Color | Chlorophyll-a Concentration , Diffuse Attenuation Coefficients , Suspended Particulate Matter | MSL12 | Level 4 | Global | 2km+ | 24+ hours (Delayed) | NOAA , Sentinel-3 , SNPP | OLCI , VIIRS |
NOAA MSL12 Ocean Color - Near Real Time - VIIRS single-sensor SNPP and NOAA-20
|
N/A | Present | Ocean Color Level 2 (EDR) is produced through NOAA Multi-Sensor Level 1 to Level 2 processing system (MSL12) from IDPS satellite data record (SDR, Level 1b). Level 3 mapped and composite products are also available, now including a 2-sensor (VIIRS: SNPP plus NOAA-20) merged daily chlorophyll and diffuse attenuation coefficients (Kd(490) and Kd(PAR) . |
Ocean Color | Chlorophyll-a Concentration , Diffuse Attenuation Coefficients , Normalized Water-Leaving Radiances , Ocean Color Quality Score | MSL12 | Level 2 , Level 3 | Global , CoastWatch US Regions | 100m < 2km , 2km+ | 0 Hours <= 24 Hours (NRT) | NOAA , SNPP | VIIRS |
| NOAA MSL12 Ocean Color - Science Quality - VIIRS SNPP |
2011 | Present | VIIRS Science Quality Ocean Color Level 2 (EDR) is produced by NOAA/STAR Ocean Color Team through NOAA Multi-Sensor Level 1 to Level 2 processing system (MSL12) using an improved calibration for the satellite data record (OC-SDR, which is Level 1b). CoastWatch Level-3 composites, binned and mapped data products also available. |
Ocean Color | Chlorophyll-a Concentration , Diffuse Attenuation Coefficients , Normalized Water-Leaving Radiances , Ocean Color Quality Score | MSL12 | Level 2 , Level 3 | Global , CoastWatch Global Sectors | 100m < 2km , 2km+ | 0 Hours <= 24 Hours (NRT) | SNPP | VIIRS |
| NOAA MSL12 Ocean Color, near real time, VIIRS multi-sensor SNPP + NOAA-20 daily merge |
N/A | Present | VIIRS Ocean Color multi-sensor (SNPP + NOAA-20) daily merge (Level 3 composite) is produced from the NOAA Multi-Sensor Level 1 to Level 2 processing system (MSL12) near real time processing stream by the NOAA ocean color science team. NOAA CoastWatch converts files to NetCDF and serves them here. |
Ocean Color | Chlorophyll-a Concentration , Diffuse Attenuation Coefficients | MSL12 | Level 3 | Global | 2km+ | 24+ hours (Delayed) | NOAA , SNPP | VIIRS |
| NOAA MSL12 Ocean Color, near real-time, VIIRS multi-sensor (SNPP + NOAA-20), chlorophyll DINEOF gap-filled analysis |
N/A | Present | VIIRS Ocean Color multi-sensor gap-filled analysis (Level 4) is produced with input from the VIIRS multi-sensor (SNPP + NOAA-20) daily merged chlorophyll and monthly climatology using the DINEOF method of interpolation for gap-filling. The chlorophyll algoritm used is OCI. The NOAA ocean color science team provides the gap-filled data file to NOAA CoastWatch. CoastWatch converts these to the NetCDF product and serves them. |
Ocean Color | Chlorophyll-a Concentration | MSL12 | Level 4 | Global | 2km+ | 24+ hours (Delayed) | NOAA , SNPP | VIIRS |
| NOAA MSL12 Ocean Color, science quality, VIIRS multi-sensor (SNPP + NOAA-20), chlorophyll DINEOF gap-filled analysis |
N/A | Present | VIIRS Ocean Color multi-sensor gap-filled analysis (Level 4) is produced with input from the VIIRS multi-sensor (SNPP + NOAA-20) daily merged chlorophyll and monthly climatology using the DINEOF method of interpolation for gap-filling. The chlorophyll algorithm used is OCI. The NOAA ocean color science team provides the gap-filled data file to NOAA CoastWatch. CoastWatch converts these to the NetCDF product and serves them. |
Ocean Color | Chlorophyll-a Concentration | MSL12 | Level 4 | Global | 2km+ | 24+ hours (Delayed) | NOAA , SNPP | VIIRS |
| NOAA NCEI Blended Seawinds (NBS v2) |
1987 | Present | The NOAA NCEI Blended Seawinds (NBS) version 2.0 dataset synthesizes observations from multiple satellites (up to seven satellites since June 2002) to create gridded wind speeds (10m, neutral). This is an updated version of the existing NOAA NBS v1.0, which is a global gridded 0.25° and 6-hourly sea surface winds product that has wide applications in marine transportation, marine ecosystem and fisheries, offshore winds, weather and ocean forecasts, and other areas. |
Sea Surface Winds | Sea Surface Vector Winds | N/A (Unspecified) | Level 4 | Global | 2km+ | 0 Hours <= 24 Hours (NRT) , 24+ hours (Delayed) | Aqua , Coriolis , DMSP , GCOM-W , GPM , MetOp , QuikSCAT , SMAP , TRMM | AMSR-E , AMSR2 , ASCAT , GMI , SeaWinds , SMAP , SSMIS , TMI , WindSat |
| Ocean Color - Near Real Time - OLCI Sentinel-3A and 3B Global Coverage |
2016 | Present | OLCI Sentinel-3A and 3B global coverage ocean color including visible remote sensing reflectances and derived parameters such as chlorophyll-a concentration and light attenuation coefficients. |
Ocean Color | Chlorophyll-a Concentration , Diffuse Attenuation Coefficients , Remote Sensing Reflectance | OC4Me | Level 2 , Level 3 | Global , CoastWatch US Regions | 100m < 2km | 0 Hours <= 24 Hours (NRT) | Sentinel-3 | OLCI |
Ocean Color - Near Real Time - OLCI Sentinel-3A and 3B Regional Coverage
|
N/A | Present | OLCI Sentinel-3A and 3B regional coverage (US coasts of interest, a.k.a. "CONUS" but including Hawaii) Level-3 mapped daily composites of ocean color remote sensing reflectances (Rrs(λ), chlorophyll-a concentration and derived water quality related products including diffuse attenuation coefficient at 490 nm (Kd490), normalized fluorescence line height (NLFH), and total suspended matter (TSM) from the EUMETSAT processing. |
Ocean Color | Chlorophyll-a Concentration , Diffuse Attenuation Coefficients , Normalized Fluorescence Line Height , Remote Sensing Reflectance , Suspended Particulate Matter | OC4Me | Level 3 | CoastWatch US Regions | 100m < 2km | 0 Hours <= 24 Hours (NRT) | Sentinel-3 | OLCI |
| Ocean Color - Radiances from MOBY - Field Observations |
1997 | Present | The Marine Optical BuoY (MOBY) project provides in situ data for the vicarious calibration of ocean color satellite data (Clark et al., 1997). MOBY is a hyperspectral optical instrument system moored off the island of Lanai in Hawaii. The system was designed for measuring sunlight incident on (surface irradiance) and emitted out of (water-leaving radiance) the ocean. These measurements are provided in near real time for the vicarious calibration procedures conducted by ocean color scientists and also used for routine monitoring of satellite sensor performance. MOBY has been funded by NOAA since October 2007. |
Field Observations (In situ) , Ocean Color | Ocean Color Calibration | N/A (Unspecified) | Level 1 | Field Observations | N/A (Field Observations) | 24+ hours (Delayed) | MOBY | MOBY |
| Oceanic Heat Content, Mixed Layer Depth and Depths of 20°C and 26°C Isotherms |
N/A | Present | Oceanic Heat Content (OHC) is the measure of the integrated vertical temperature from the sea surface to the depth of the 26°C isotherm and computed from the altimeter-derived isotherm depths in the upper ocean relative to 20°C. Global 0.25 degree grids are generated daily for OHC, mixed layer depth and depths of 20°C and 26°C isotherms for 3 ocean basins: North Atlantic, North Pacific and South Pacific |
Ocean Heat Content | Depth of 20° and 26° Isotherms , Ocean Heat Content , Ocean Mixed-Layer Depth , Sea Surface Height Anomalies , Sea Surface Temperature - Geostationary , Sea Surface Temperature - Polar-orbiting | N/A (Unspecified) | Level 4 | Global | 2km+ | 24+ hours (Delayed) | CryoSat-2 , GOES-East , GOES-West , Himawari , JASON-2 , JASON-3 , MetOp , NOAA , SARAL , SNPP | ABI , AHI , AltiKa , AVHRR , GOES Imager , Poseidon-3 , Poseidon-3B , SIRAL , VIIRS |
SAR Composite Arctic Imagery (normalized radar cross section)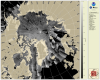
|
N/A | Present | The daily composite of Synthetic Aperture Radar (SAR) Normalized Radar Cross Section (NRCS) imagery covering the Arctic and sub-Arctic maritime regions over a period of one day are available at 1-km resolution. These high-resolution, weather- and time-agnostic measurements of surface backscatter contain detailed information tailored for sea ice classification purposes. |
Sea Surface Roughness | Normalized Radar Cross-Section | N/A (Unspecified) | Level 2 , Level 4 | Arctic and Sub-Arctic Maritime | 100m < 2km | 24+ hours (Delayed) | RadarSat-2 , RCM , Sentinel-1 | SAR RCM |
| Sea level Anomaly and Geostrophic Currents, multi-mission, global, optimal interpolation, gridded |
2017 | Present | The NOAA Laboratory for Satellite Altimetry's (LSA) sea surface height team produces 0.25-degree longitude/latitude Level-3 sea level anomaly (SLA) daily datasets by applying optimal interpolation to along-track satellite observations over the global ocean from a constellation of radar altimeter missions. Theses grids are produced with near-real time (3-5 hour latency) data. Geostrophic Currents are produced from the SLA and are included in the dataset. |
Ocean Currents , Sea Surface Height | Geostrophic Currents , Sea Surface Height | RADS | Level 4 | Global | 2km+ | 0 Hours <= 24 Hours (NRT) | CryoSat-2 , JASON-2 , JASON-3 , SARAL , Sentinel-3 , Sentinel-6 | AltiKa , Poseidon-3 , Poseidon-3B , SIRAL , SRAL |
| Sea Surface Salinity - Near Real Time - MIRAS SMOS |
2010 | Present | CoastWatch/OceanWatch produces 0.25-degree longitude/latitude Level-3 gridded sea-surface salinity (SSS) daily and 3-day mean datasets by box averaging European Space Agency (ESA) Soil Moisture – Ocean Salinity (SMOS) mission’s Microwave Imaging Radiometer with Aperture Synthesis (MIRAS) satellite observations over the global ocean. |
Sea Surface Salinity | Sea Surface Salinity | N/A (Unspecified) | Level 3 | Global | 2km+ | 0 Hours <= 24 Hours (NRT) | SMOS | MIRAS |
| Sea Surface Salinity - Near Real Time - SMAP |
2015 | Present | CoastWatch/OceanWatch produces 0.25-degree longitude/latitude Level-3 gridded sea-surface salinity (SSS) daily mean dataset by box averaging Soil Moisture Active Passive (SMAP) satellite observations over the global ocean. |
Sea Surface Salinity | Sea Surface Salinity , Sea Surface Wind Speed | N/A (Unspecified) | Level 3 | Global | 2km+ | 0 Hours <= 24 Hours (NRT) | SMAP | SMAP |
| Seascape Pelagic Habitat Classification |
N/A | Present | MBON Seascapes identifies spatially explicit water masses with particular biogeochemical features using a model and satellite-derived measurements. The seascape product is generated as monthly and 8-day composites at 5 km spatial resolution |
Seascape Classification | Pelagic Seascape Classification | N/A (Unspecified) | Level 4 | Global | 2km+ | 24+ hours (Delayed) | Aqua , DMSP , GOES-East , GOES-West , NOAA , Terra | ABI , GOES Imager , MODIS , SSMIS , VIIRS |
Seviri (MSG) - Geostationary - Level 3
|
N/A | Present | The National Oceanic and Atmospheric Administration's Office of Satellite Data Processing and Distribution are generating operational sea surface temperature (SST) retrievals from the Geostationary Operational Environmental Satellites GOES-East and West. The generation of SSTs began with GOES-8 in 2000 and has continued to be generated through GOES-15 |
Sea Surface Temperature | Sea Surface Temperature - Geostationary | N/A (Unspecified) | Level 3 | CoastWatch US Regions | 2km+ | 0 Hours <= 24 Hours (NRT) | Meteosat | SEVIRI |
| Synthetic Aperture Radar (Surface Roughness) Winds |
N/A | Present | Spaceborne Synthetic Aperture Radar (SAR) imagery maps the surface microwave radar reflectivity at resolutions from a sub-meter to 100 m depending on the particular SAR satellite and mode. Since a radar provides its own illumination, imagery is independent of the time of day. At typical radar frequencies, SARs can image through clouds, so SARs are considered "all-weather" instruments. Several geophysical parameters can be derived from SAR including sea surface wind speed. |
Sea Surface Roughness , Sea Surface Winds | Normalized Radar Cross-Section , Sea Surface Wind Speed | N/A (Unspecified) | Level 1 , Level 2 , Level 3 | Selective Acquisitions | 0 m <= 100 m , 100m < 2km | 0 Hours <= 24 Hours (NRT) | RadarSat-2 , Sentinel-1 | SAR , SAR-C |
Synthetic Aperture Radar Imagery (NRCS)
|
N/A | Present | Spaceborne Synthetic Aperture Radar (SAR) imagery maps the surface microwave radar reflectivity at resolutions from a sub-meter to 100 m depending on the particular SAR satellite and mode. Since a radar provides its own illumination, imagery is independent of the time of day. At typical radar frequencies, SARs can image through clouds, so SARs are considered "all-weather" instruments. Several geophysical parameters can be derived from SAR including sea surface wind speed. |
Sea Surface Roughness | Normalized Radar Cross-Section , Sea Surface Wind Speed | SAROPS | Level 1 , Level 2 , Level 3 | Selective Acquisitions | 0 m <= 100 m , 100m < 2km | 0 Hours <= 24 Hours (NRT) | RadarSat-2 , RCM , Sentinel-1 | SAR , SAR RCM , SAR-C |
True Color OLCI Sentinel-3A/B
|
2016 | Present | OLCI true color products are generated from atmospheric corrected rho_s bands. Data are available in mapped 300m regions in near real-time CoastWatch HDF format and are compatible with the CoastWatch Utilities. |
True Color Imagery | True Color Imagery (RGB) | N/A (Unspecified) | Level 1 , Level 3 | Global , CoastWatch US Regions | 100m < 2km | 0 Hours <= 24 Hours (NRT) | Sentinel-3 | OLCI |
True Color VIIRS S-NPP/NOAA-20
|
N/A | Present | True color bands are provided from VIIRS on both S-NPP and NOAA-20 VIIRS spacecraft. These top-of-atmosphere products are generated from the emissive bands (M-bands) for wavelengths corresponding to Red, Green, and Blue and are provided in CoastWatch HDF and PNG daily composite mapped regions |
True Color Imagery | True Color Imagery (RGB) | N/A (Unspecified) | Level 3 | Global , CoastWatch US Regions | 2km+ | 0 Hours <= 24 Hours (NRT) | NOAA , SNPP | VIIRS |
Vector Winds ASCAT Metop-A/B/C
|
2020 | Present | Ocean Surface Vector Winds (OSVW; magnitude and direction) from the Advanced Scatterometer (ASCAT) on Metop-A, Metop-B, and Metop-C. Metop-A was decommissioned November 15, 2021. |
Sea Surface Winds | Sea Surface Vector Winds | N/A (Unspecified) | Level 3 | Global | 2km+ | 0 Hours <= 24 Hours (NRT) | MetOp | ASCAT |
Vector Winds OSCAT-2 SCATSAT-1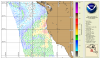
|
N/A | Present | Ocean Surface Vector Winds (OSVW; magnitude and direction) from the Ocean Scatterometer (OSCAT) on SCATSAT-1. |
Sea Surface Winds | Sea Surface Vector Winds | N/A (Unspecified) | Level 3 | Global | 2km+ | 0 Hours <= 24 Hours (NRT) | ScatSat-1 | OSCAT |
| VIIRS - Sea Ice Concentration, Ice Thickness, Ice Surface Temperature |
N/A | Present | VIIRS Sea Ice Concentration, Sea Ice Thickness and Ice Surface Temperature NOAA CoastWatch/OceanWatch/PolarWatch Level 3, Daily and daily 4-day rolling merged, mapped composites in both polar stereographic projections and CW sector mapped for Northern and Southern hemispheres. |
Polar Sea Ice | Sea Ice Concentration , Sea Ice Temperature , Sea Ice Thickness , Visible And Near IR Radiometry | N/A (Unspecified) | Level 3 | CoastWatch Global Sectors , Polar (Artic/Antarctic) | 100m < 2km | 0 Hours <= 24 Hours (NRT) | NOAA , SNPP | VIIRS |
| VIIRS single-sensor S-NPP and NOAA-20 Anomaly products |
N/A | Present | Near-real-time (NRT) global daily chlorophyll-a (Chl-a) anomaly products that can be used to detect and identify algae blooms from satellite ocean color measurements such as those from the Visible Infrared Imaging Radiometer Suite (VIIRS) onboard the Suomi National Polar-orbiting Partnership (SNPP) and NOAA-20. Specifically, the production of the two Chl-a anomaly products, one for the Chl-a anomaly in difference and another for the Chl-a anomaly ratio (actually, the proportional difference or relative difference; product is labelled "pdif" in the files) compared to the 61-day Chl-a median value from the previous time period (as a Chl-a reference), has been implemented in the daily global NRT satellite data processing. These two Chl-a anomaly products represent the global ocean and coastal/inland water Chl-a abnormal condition for a given location and can provide more complete characteristics for the daily phytoplankton (or algae) biomass status by comparing to the normal condition. |
Ocean Color | Chlorophyll-a Anomaly Difference , Chlorophyll-a Anomaly Ratio | MSL12 | Level 3 | Global | 2km+ | 24+ hours (Delayed) | NOAA , SNPP | VIIRS |
| Winds from Special Sensor Microwave Imager (SSM/I) |
N/A | Present | Defense Meteorological Satellite Program (DMSP) / Special Sensor Microwave Imager (SSM/I) Wind Speed |
Sea Surface Winds | Sea Surface Wind Speed | N/A (Unspecified) | Level 3 | Global | 2km+ | 0 Hours <= 24 Hours (NRT) | DMSP | SSMIS |